New Data Analysis Shows SYRCityline Helps Organize Resident Service Requests

Based on data from 2023, the web portal and mobile app powered by SeeClickFix have allowed City Hall to centralize and designate requests more efficiently.

iPad showing SeeClickFix application opened and displaying a map of Syracuse.

Photo: Civic Plus

Published: Dec. 10, 2023

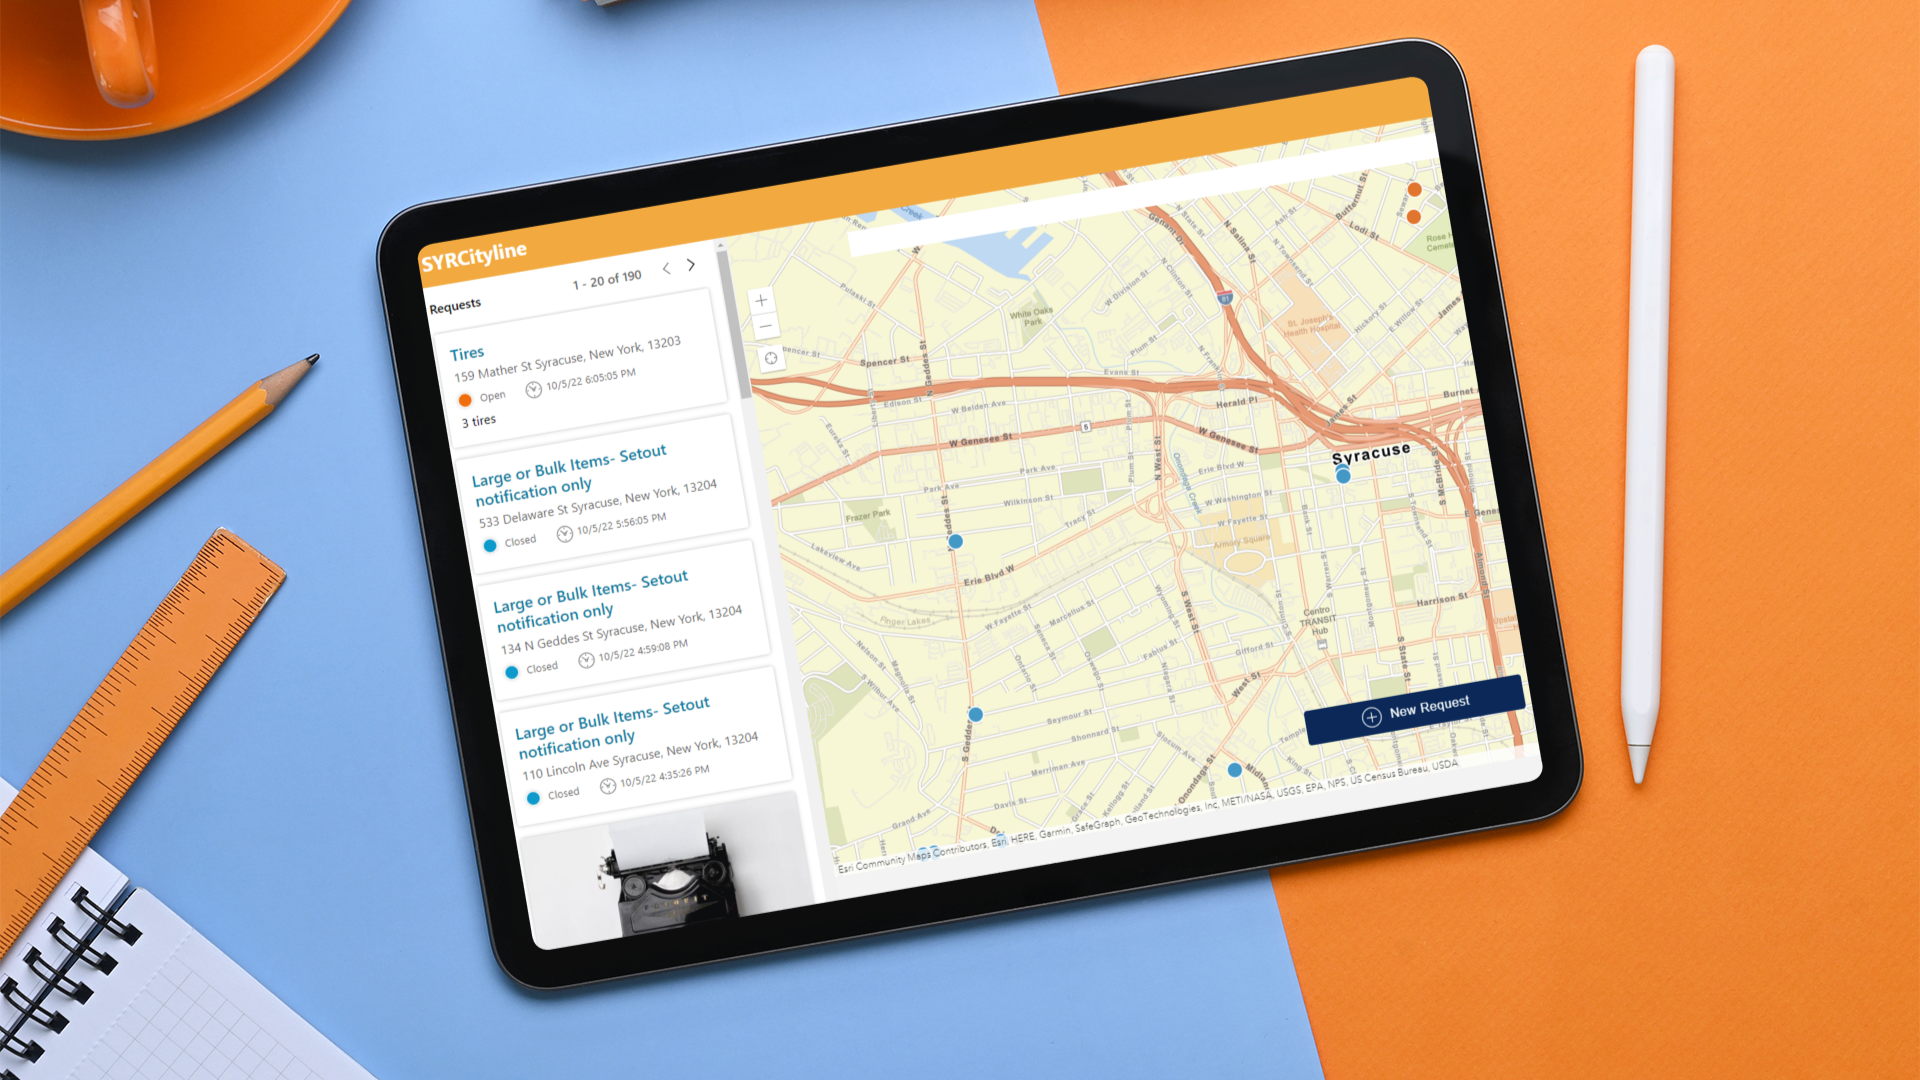
In 2021, the City of Syracuse implemented new software to its resident engagement portal, Cityline, as part of an effort to revitalize the city's processes conducted by the Office of Analytics, Performance and Innovation (API). Previously a process fueled by resident emails and calls, the new portal—renamed SYRCityline—now includes a website and mobile app powered by SeeClickFix, a company that specializes in facilitating citizens' communications with local governments.

For the last two years, these new tools have allowed residents to submit non-emergency requests to the city and track their progress. As part of this initiative, the city has also committed to publishing data collected by the software to its Open Data Portal, updating it daily. Based on data from 2023, it is evident that Syracuse citizens use this tool extensively and that through its delegation, it has organized the city's processing of service requests.

According to Chief Innovation and Data Officer Nicolas Diaz, one of the software's assets is that it has allowed City Hall to centralize requests and set a specialized standard of service for each type. To accomplish this, the app allows citizens to classify requests into different categories, which then helps the Digital Services Department assign them to a specific government agency.

For example, if a resident categorizes a request as a "large bulk item," it is designated to the "Garbage, Recycling and Graffiti" agency. This agency has its own established service-level agreement (SLA) that it then uses to address the request in a standardized yet timely manner. The pie charts below demonstrate the number of requests submitted in 2023 displayed by category and agency. There are nine agencies and over 50 categories—some of which have been grouped together for coherence in this analysis.

However, according to Diaz, SeeClickFix does not just aid in designating information. The software has an "advanced functionality" that allows requests to enter a "feedback loop," in which residents can receive live updates—sometimes including photographs—on the progress of their requests while also being able to observe other residents' requests. "All of that functionality is a lot more advanced than just a website or like a Google Form," Diaz said.

Part of that feedback loop also includes an internal system of accountability between City Hall and the agencies, said Systems Analyst Nicole Broadnax. The software's data collection and filtering allows the city's Digital Services Department to analyze the "bottlenecks" of service requests, which they then turn into monthly visuals and reports.

In addition, the Digital Services team tracks any blatant drops in the agencies' SLA times. Broadnax said part of this work includes finding the agency, or individual, in charge of the overdue requests and asking why they are taking longer than usual. This direct interaction allows issues to be resolved quickly and is all possible thanks to the system's centralization of requests. Comparing the agencies' different SLA times with the average number of days to close requests reveals that this process has proven effective for some agencies—while for others, it has not.

As seen in the horizontal bar graph, each agency has its own designated time limit for which a request can remain untouched (SLA), with "Green Spaces, Trees and Public Utilities" having the longest (35 days). When comparing that to the average days to close requests (vertical bar graph), this agency's average is 16 days, cutting the SLA time almost in half. However, observing the agency "Streets, Sidewalks and Transportation," which has an average SLA time of six days and an average of 12 days to close requests, it is clear that not all agencies are meeting the time limits quite as effectively.

These discrepancies are due to the fact that some requests are more nuanced than others. According to Broadnax, different factors can affect the efficiency with which requests are handled, including the complexity of the request, understaffing problems, a sudden surge of requests or even seasonal complications like a winter storm.

The nuance between requests can also be observed when analyzing the average number of days to close by category. As seen in the large bar graph, the requests that take the longest to close on average are "water-related concerns," which belong to the "Water and Sewage" agency. On average, this category takes 38 days to close, while its agency average is only five days. According to Mary Rachel Keville, a research analyst at Syracuse University who conducted a similar analysis, this discrepancy might be because requests within this category are more complex and are harder to close than other requests designated to the agency, creating significant outliers in the data that affect the average.

However, the Digital Services team welcomes these outliers since they are precisely what guides their accountability work. According to Diaz, the software's ability to pinpoint these areas of improvement allows agencies to address issues directly, creating a habit of assessment informed by data. "It's a learning process, to be honest. It's about building a culture of data," Diaz said.

But none of this is possible without the residents who diligently report their service request needs. Broadnax mentioned how a large part of this initiative is to continue to update the app's accessibility and user-friendliness. SeeClickFix is already available in different languages, and offers display adjustments for size and color. Additionally, the city continues to offer a call center, email, or letter option for submitting service requests.

However, the ultimate goal is to ensure all residents know and can use this app. The horizontal bar graph shows that requests submitted through SeeClickFix come from all four city quadrants, demonstrating that this goal is already en route (quadrants are assigned to requests based on longitude and latitude). Still, the Digital Services Department and the API will continue collaborating and updating the app to ensure it is accessible to everyone.

"If we come to find out that there is something that we haven't touched on, we all meet and talk about those things, and they [the API] try to get a jump on how they can fix those things," Broadnax said.